
In the last months, we have been working hard to get ready for the future. At the same time, we hit our $100k ARR milestone! We are very happy with the features that are only possible because of all the groundwork we did. In this post, we share some extra numbers around our milestone and dig into our newly developed features of the last months.
- New data structure for new features
- Filtering data
- APIs
- $100k milestone
- Time on page
- Social images
- Transparency
New data structure for new features
We developed our database structure from the ground up and build on top of the fantastic work of Elastic. We are very grateful that we can use their open-source software to grow our business to the next level. In this update I will walk you through all the updates we added to Simple Analytics and some background information on the choices we made.
Node.js example to show the top 10 UTM sources for Hacker News in Elasticsearch
js
const { Client } = require("@elastic/elasticsearch");
const client = new Client({ node: "http://localhost:9200" });

const {
  body: { hits },
} = await client.search({
  index: "pageviews-*",
  body: {
    query: { term: { hostname: "news.ycombinator.com" } },
    aggs: {
      top_10_utm_sources: {
        terms: { field: "utm_source", size: 10 },
      },
    },
  },
});

console.log(hits);
At the time we launched the first version of Simple Analytics back in 2018 we wanted to build the prototype as fast as possible. That required us to use the tools we were familiar with and that included the database. Because of that we picked PostgreSQL (a very common database) and stored all page views in it. It worked super nice and as we grew we added caching tables with aggregated data. This required us to update the database schema and caching tables as we build new features. Not ideal if you want to rapidly iterate on your product.
Filtering data
One of the most requested features was being able to filter on certain data points. If you would like to know which pages are popular in Germany you would expect to click on Germany and see all the other data update with Germany filtered. To make this possible within our previous database solution it would request much more work and way more error-prone.
APIs
Because we use our new database system for our APIs as well, it has been largely expanded. As a customer, you can get all the data you see in our dashboard. We see many customers using it for amazing use cases.
- Nomad List uses the Simple Analytics data to calculate the price of their ads on certain pages.
- Chartbrew can make fancy charts based on Simple Analytics data
- Niklas Metje created an iOS widget with Scriptable app
There are many more customers who API internally, but we can't show that, obviously.
See our documentation to learn about our APIs
$100k milestone
While writing this blog post hit a nice milestone for our business. We hit $100k ARR (Annual Recurring Revenue). For us, it feels like a big thank you from all our customers. All the new features were not possible without all the customers that already believed in our product in the early stage.

Time on page
In the last month, we added time on the page to our dashboard. As we usually build things from the ground up, we think about how to make our numbers better than what customers would see at competitors. We don't want our customers to think that their website is doing great with huge numbers instead of what is actually happening. Time on page is a great example of that.
For example, Google Analytics does show time on site and time on page metrics on their dashboard. This metric is being used as the actual time on page by most people. We will clarify this in a later blog post. In short, Google Analytics uses averages for data points that have quite some outliers. In mathematics, this is considered bad practice. We use the median to get the time on page. Google Analytics also calculates the time when a page is in the background. One of the reasons why their time on page is far too high (they do limit it to sessions length, which is 30 minutes by default).
It has its advantages to build new features without looking too much to the competition first. Instead of just copy-pasting, we try to really think about those numbers and methods and find the best ones for our customers.
Social images
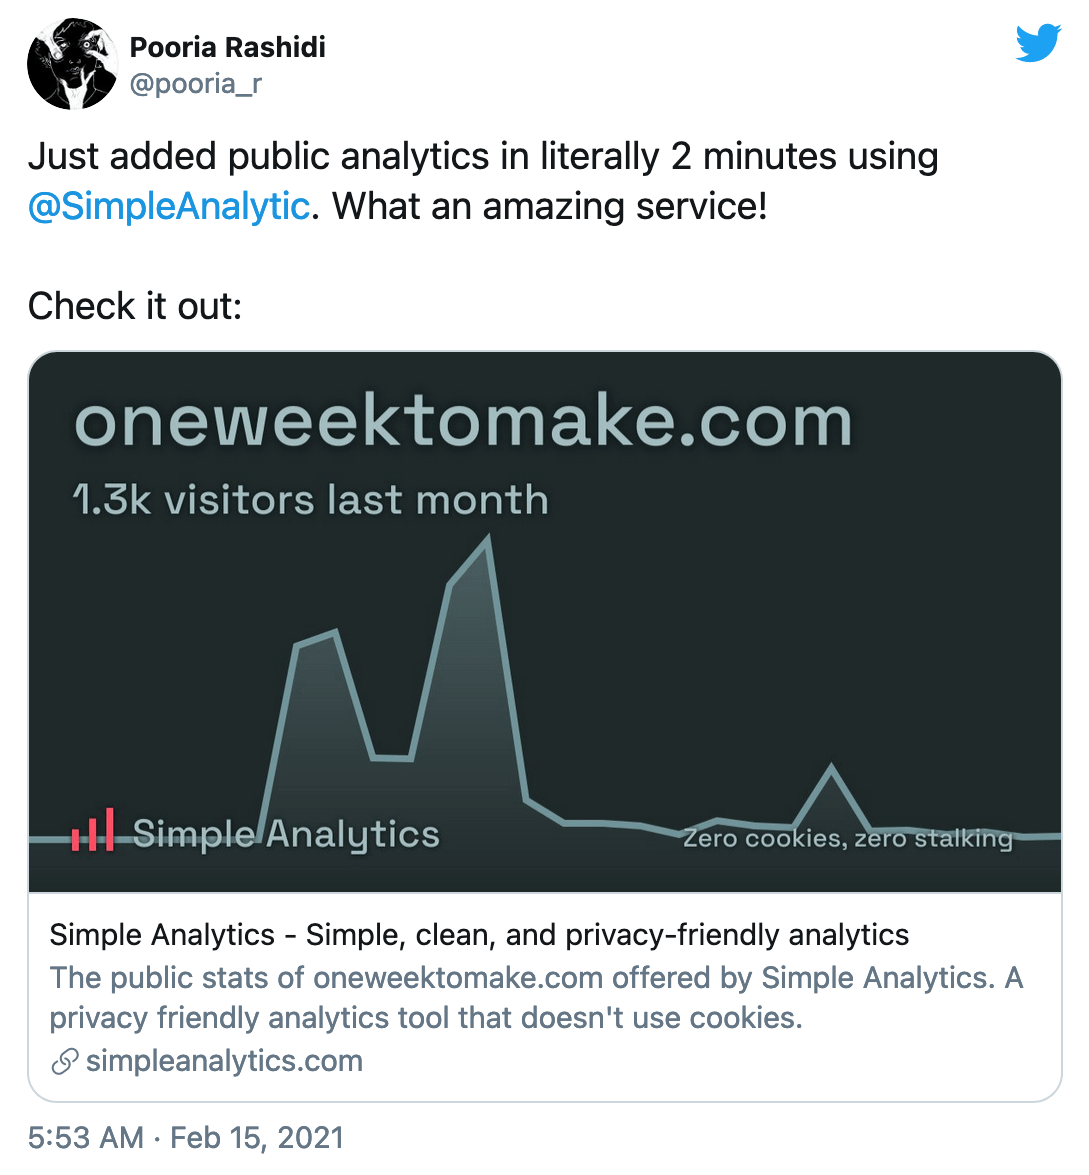
Because of getting data out of our API, it's easier for us to develop new features. One of the features that we wanted to build for a long time were the social media images. Because we offer the option to make a dashboard public, you are encouraged to share your statistics. To make that experience more awesome, we decided to integrate the chart into it. Here is an example for oneweektomake.com.
Transparency
As a transparent startup, we care about sharing our insights with you. We updated our open page again with new data for last month.
Thanks for reading, and please ask any questions if you have some. We love to make this interesting for everybody. Have a good one!