
Google is adding a page experience update to their search result ranking. They recently announced it would roll out in mid-June and finished at the end of August. In this blog post, we the performance impact of using Google Analytics vs. using no analytics vs. using Simple Analytics.
- Core Web Vitals using Google Lighthouse
- Performance impact of analytics tools
- Test with basic page
- Test with more complex website
- Asynchronous code
- Conclusion
- Run your own test
- How we stay so fast
Core Web Vitals using Google Lighthouse
An important change to the Google search results will be the impact of so-called Core Web Vitals metrics. These metrics ensure a better experience for the visitor. These Core Web Vitals contain three metrics:
We don't go too deep into these metrics, but the general message is that they are all calculated within the performance score of Google Lighthouse. Lighthouse is a tool that Google created to measure the performance of a website. It gives a score to 4 categories: performance, accessibility, best practices, and SEO. The Core Web Vitals are included in this first category: the performance score. You can try it out yourself at web.dev/measure (Google's online interface for Lighthouse). It runs on the servers of Google.
To learn more about Core Web Vitals, you should check out Ahrefs blog post. It goes in-depth about those three metrics.
Google will begin using page experience as part of their ranking systems starting in mid-June 2021. However, page experience won't play its full role as part of those systems until the end of August.
Performance impact of analytics tools
Analytics tools do impact performances on websites. They usually add a script to the website that adds functionality. Logically this has a cost in terms of performance. Some analytics businesses care a lot about this, and others don't have that high priority. At Simple Analytics, we care a lot about the impact of our embedded script on our customers' websites. We don't want to load big scripts into the browser of our customers. Although this all sounds nice, we should prove it to you as well.
Olav Pekeberg compared his website with and without Google Analytics. He found that he got a performance score boost from 93 (with GA) to 100 (without GA). The score goes from 1 to 100, and the higher, the better. He asked us how Simple Analytics was performing compared to Google Analytics. We should perform better based on all the actions we took but were triggered to prove ourselves.
We started with running a few tests on our computer, but the results always varied. We couldn't get a consistent result. This could have been because of the internet connection or other factors we don't know about. Then we did run it Google's online interface for Lighthouse. Every time we did run the test, it showed us a different result. As we wanted to know if we performed better, we needed to run it a lot.
Luckily Dan Sloan suggested that we run Lighthouse on a fresh VPS using the command line tool and run it a few times, grab the data via JSON, then compare without SA. That will give you the best sample set without other interfering factors.
Test with basic page
We followed Dan's advice and created a little Node.js script around Lighthouse. We did run this test 500 times to get a trustworthy average.
We created three pages on our blog; one with no analytics script, one with Simple Analytics, and one with Google Analytics. All are using the latest versions with default configurations. The test pages are hidden for our blog visitors, so we don't accidentally send data to Google.
The test tool ran around 2 hours to complete because every test did run synchronously. We didn't want to run them in parallel as this could interfere with the test results.
| Type | Tool | Performance score | Times | Tester |
|---|---|---|---|---|
| Lighthouse | None | 95.5 (0%) | 500 | Simple Analytics |
| Lighthouse | Simple Analytics | 95.5 (0%) | 500 | Simple Analytics |
| Lighthouse | Google Analytics | 93.8 (-1.7%) | 500 | Simple Analytics |
As you can see, we don't impact the performance score with Simple Analytics at all. But don't take our word for it. We made our test public, so everybody can run the test independently. Please share your results.
Test with more complex website
Olav Pekeberg did a test that showed more extreme results. He built plankepriser.no, a website to give price transparency of construction materials in the Norwegian market. The website is more complex than the website in the previous test.
He did run the tests both on Lighthouse and Google Page Speed. Both systems check for the Core Web Vitals. We rerun the test because 10 can be assumed a low number. We did run the test ourselves on his website as well. We ran that test 100 times.
| Type | Tool | Performance score | Times | Tester |
|---|---|---|---|---|
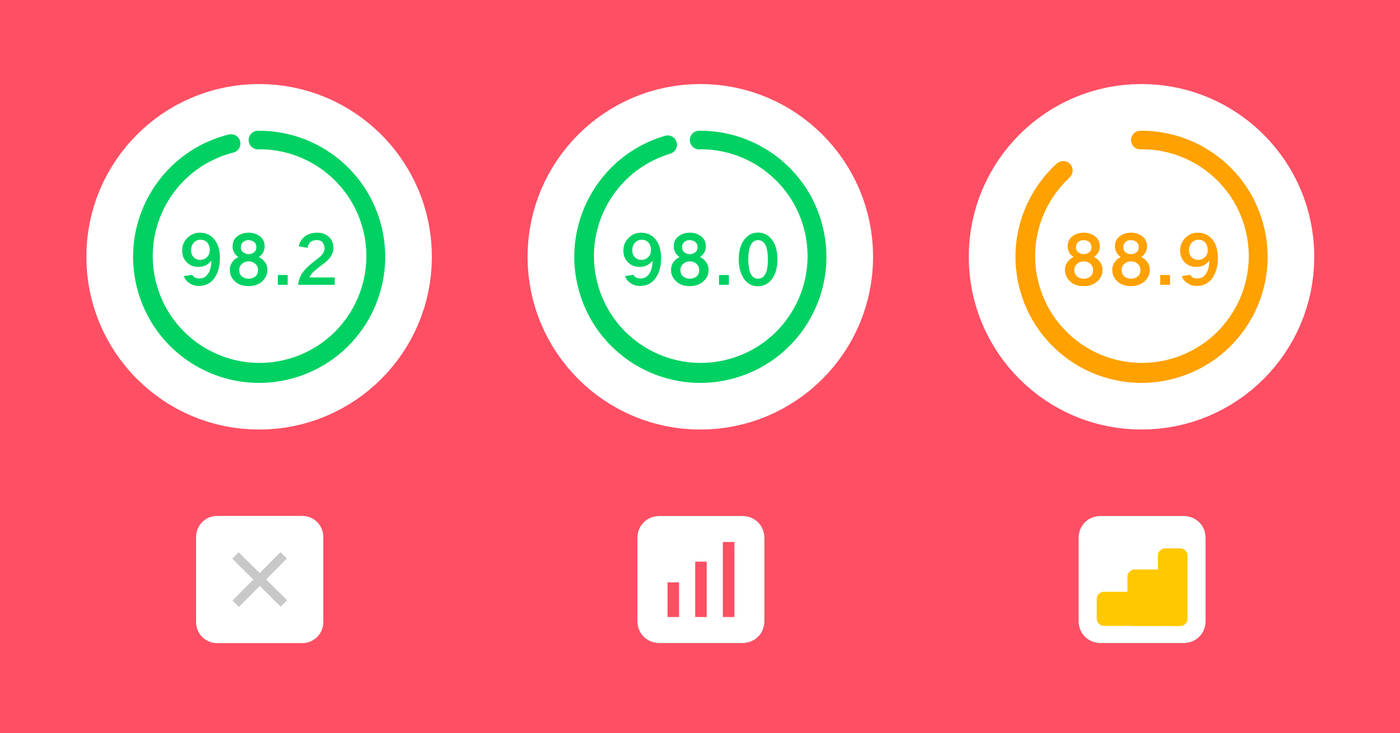
| Page Speed | None | 98.2 (0%) | 10 | Pekeberg |
| Page Speed | Simple Analytics | 98.0 (-0.2%) | 10 | Pekeberg |
| Page Speed | Google Analytics | 88.9 (-9.3%) | 10 | Pekeberg |
| Lighthouse | None | 99.4 (0%) | 10 | Pekeberg |
| Lighthouse | Simple Analytics | 99.9 (+0.5%) | 10 | Pekeberg |
| Lighthouse | Google Analytics | 97.0 (-2.4%) | 10 | Pekeberg |
| Lighthouse | None | 100 (0%) | 100 | Simple Analytics |
| Lighthouse | Simple Analytics | 99.9 (-0.1%) | 100 | Simple Analytics |
| Lighthouse | Google Analytics | 96.2 (-3.9%) | 100 | Simple Analytics |
The public test data is available on his GitHub repo.
Asynchronous code
There is a common misconception around asynchronous code. People believe there is no impact on the performance score. This belief is not valid. We did run our test with scripts running with the async attribute. Simple Analytics did support this from the start; Google Analytics followed by making it part of their latest embed script. It affects the performance score, therefore, on the page ranking in Google as well.
Conclusion
As you can see in the above numbers, Simple Analytics is performing better than Google Analytics. Google hurts the performance score by roughly 4%, and we almost have zero impact (0.1%).
If you care about a fast website and are still using Google Analytics, this could be a good moment to switch. Do you want to score high on SERP (Search Engine Results Page), then it could have an impact, but it's unknown how much. They write on their blog post:
..., while this update is designed to highlight pages that offer great user experiences, page experience remains one of many factors our systems take into account. Given this, sites generally should not expect drastic changes. In addition, because we're doing this as a gradual rollout, we will be able to monitor for any unexpected or unintended issues.
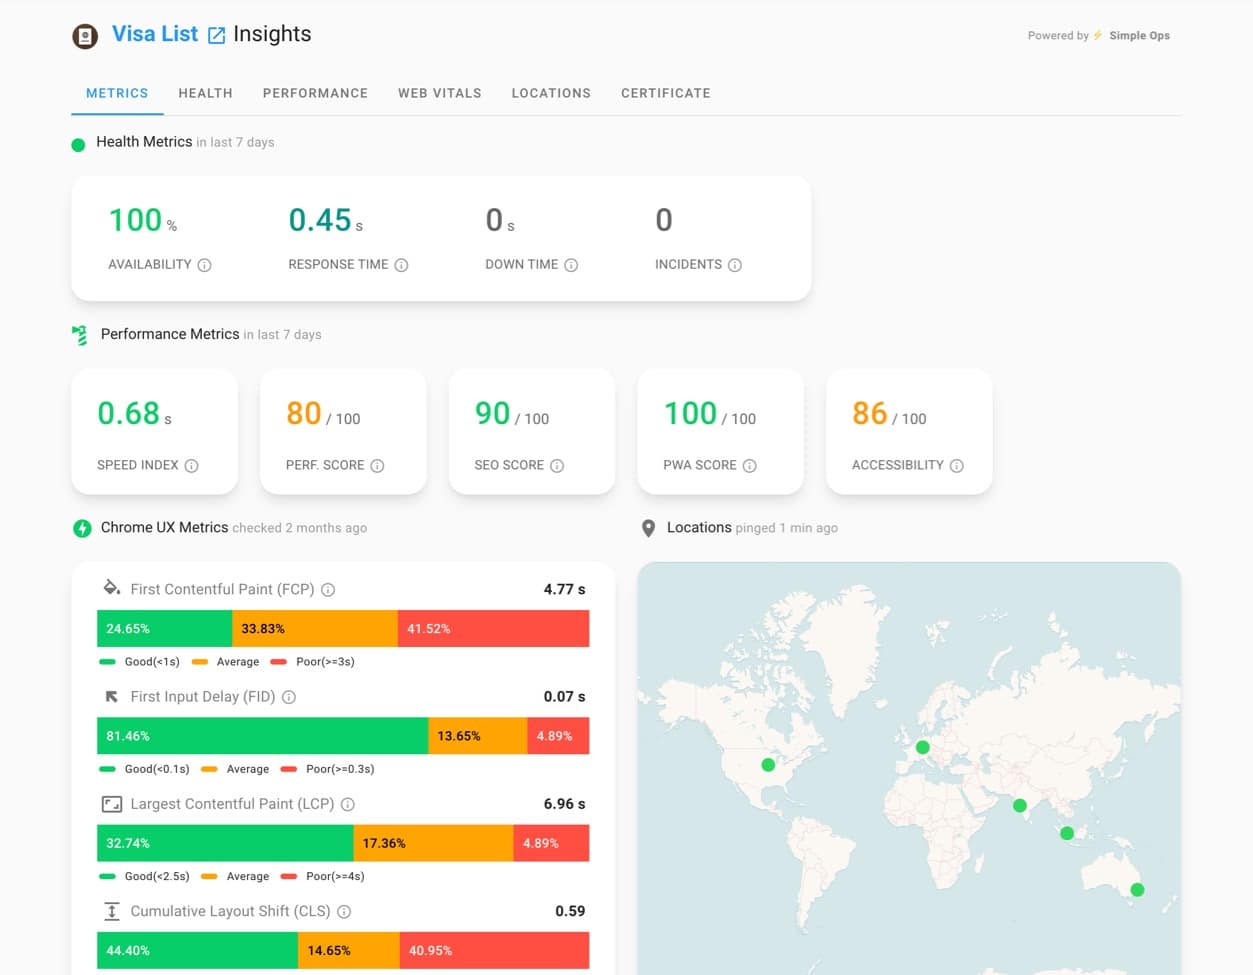
If you want to check your website performance regularly, you can check out Moz Performance Metrics or SimpleOps (not related to Simple Analytics). They both seem to be the right tool for the job. Moz also has a view on the impact of search results by the Core Web Vitals performance:
... It's going to affect all regular search results, mobile and desktop, based on certain criteria. But also, and this is an important point, Core Web Vitals are going to become a criteria to appear in Google Top Stories. These are the news results that usually appear at the top of search results.
If you have a news site and didn't use AMP before, it might be crucial to you.
Run your own test
To know if your website is slowing down by Google Analytics, try to run a few tests with web.dev/measure. Create a page where you run Google Analytics and create a copy of that page where you don't run Google Analytics.
Are you a developer? Clone our repo to run your own tests.
How we stay so fast
In recent years, we have been improving our embed script a lot. Every few months, if we found something that could run better or faster, we would add it. We added very optimized minimalization of the code, we added Brotli (and of course gzip) compression, we load our script asynchronously (loads the content of the page first), we replaced our unload function with the async Beacon API (no waiting when navigating), and made sure to keep it small in size.
We plan to keep Simple Analytics as fast and well-performing as now and raise the bar every time.
You want to know what the other differences are between Google Analytics and Simple Analytics? Read our easy answers to hard privacy questions or do the test.